25 Jan 2014 :
tech,
jekyll
Though my Jekyll setup runs perfectly smooth, I wanted to have some kind of control, if (all) pages are re-generated when I make changes to the CSS or other minor things that aren’t immediately visible.
So I wanted to have a timestamp of the page generation.
To have re-usable code, I was looking for a custom Liquid tag for that purpose and found a gist by blakesmith: render_time.rb.
Since I wanted the timestamp only as a comment in the HTML pages, I made a small change. Besides that, it’s the same - so thanks a lot blakesmith!
Here’s render_time.rb:
module Jekyll
  class RenderTimeTag < Liquid::Tag

    def initialize(tag_name, text, tokens)
      super
      @text = text
    end

    def render(context)
      "<!-- #{@text} #{Time.now} -->"
    end
  end
end

Liquid::Template.register_tag('render_time', Jekyll::RenderTimeTag)
Just drop it in your _plugins folder and add the line (enclosed in Liquid open and close tags; which I can’t do here, because the Liquid tag would then be executed… :-/)
render_time Page generated at:
to e.g. your default.html.
19 Jan 2014 :
tech,
jekyll
I write blog post now for more than five years. One thing that I observe - like any other person on the net who blogs - is that I blog less often than I want to.
Why is that? I assume it’s when the ‘process’ is cumbersome, you’ll blog less. Especially when it comes to write short posts about this and that. (Amateur) blogging should be easy and not a multi-step login-create-publish-admin job.
I tried different engines in the past; from hand-made HTML, via Wordpress to secondcrack lately. Now I reached the next stage: Jekyll.
Jekyll brings everything I want:
-
understands Markdown files:
Markdown makes WYSYWIG editors obsolete. All you need is a simple text editor and you can write blog posts. In my setup it’s the really great MarkdownPro.
-
generates static pages:
In the not too distant past, dynamic web sites where state of the art. Today we know, that (at least) for blogs you don’t need all the stuff that PHP gives you. And for the rest, there is still JavaScript. Static web sites do their job without putting any pressure on the system. You don’t have to fear memory limits, CPU load or the like.
-
processes text files:
I don’t want to use a browser to write a blog post. I want to write a text file and save it to a synced directory. Since I run an owncloud instance for various other stuff, it was really easy to create a new directory, let owncloud do the syncing and tell Jekyll to take this as its source directory. BTW: images etc. are handled exactly the same way. Can’t be more simple.
-
automatically updates the site on changes:
When I’m finished with writing a post, I want it to be live within seconds. I don’t want to push a repository. I don’t want to login somewhere just to hit the publish button. Too many steps. Jekyll has a --watch command which is all you need, to have it constantly watch for changes of anything in the source directory and it’ll start to (re-)generate your site.
-
provides a simple template system:
If you want a unique layout for your Wordpress blog, you’ll face a steep learning curve. It’s no surprise, that there’s a whole industry selling professional templates for WP. Even with secondcrack - which is definitely more simple than the most other systems - I found myself investing way too much into developing scripts. Jekyll bases it’s output on Liquid tags and though I didn’t know anything about this only some days ago, I quickly felt comfortable and produced results in little time.
Jekyll is so simple and quick. Setup is done literally in minutes. Just type gem install jekyll into your terminal and you’re basically done. No database setup, no user management. Now make one or two changes in the _config.yml file, point your web-servers document root to the output directory (or vice versa), save a markdown file in the _posts directory and you’re live.
If my theory works, you’ll see some more posts on this site than in the past. So stay tuned.
14 Jan 2014 :
google,
privacy
Google buys thermostat maker Nest for $3.2 billion in cash.
In a Q&A section of the announcement post on Nest’s company blog, the new member of the Google family tries to play down the privacy concerns of it’s users that fear, that Google will know a lot of additional things about them in the near future (emphasis mine):
Will Nest customer data be shared with Google?</br>
Our privacy policy clearly limits the use of customer information to providing and improving Nest’s products and services. We’ve always taken privacy seriously and this will not change.
So far, so good. But what would be, if the services integrate a Google product? Nest has an answer to that also:
Will Nest and Google products work with each other?</br>
Nest’s product line obviously caught the attention of Google and I’m betting that there’s a lot of cool stuff we could do together, but nothing to share today.
In plain text: Yes, we will integrate with Google services and yes, then your data will be a part of the galactic Google database.
Remember: Google is an advertising company and makes a living from knowing as much as possible about you. So, dear Nest user, be prepared to get some advices from AdSense regarding your room temperature, or some hints about a better timing for your drive to work.
07 Jun 2013 :
tech,
apple
This years developer conference to be held by Apple beginning June, 10th is teased with a headline:
Where a whole new world is developing
Apple wouldn’t be Apple, if there wasn’t a deeper meaning in this headline. So I started to think about, what this years headline could hint us to.
Everybody talks about the known things, previews of iOS 7 and MacOS 10.9 the successor of Mountain Lion, some (minor) hardware refreshes etc. And everyone seems to be sure, that we shouldn’t hold our breath hoping for a new iPhone or iPad.
What do these things have to do with the 2013 claim? Nothing.
Does the ‘new world’ mean to focus on the invasion of the iPhone into China or India, which are countries being obviously late to the iPhone party? No - we saw a China-focus in last years iOS 6. Dedicate the most import event of the Apple calendar to welcome the huge market of India? Surely not.
What actually wonders me, is that noone talks about the iWatch or Apple TV (aka iTV) in context with WWDC - o.k. iWatch seems too far away, but what about the “new world” that’s “developing” simply a new world of iOS devices, that weren’t opened for the developers until now: the Apple TV?
Therefore my money would be on the introduction of the APIs for bringing all the great content and apps to the big screen via an App Store for the Apple TV.
We’ll see.
24 Mar 2013 :
howto,
dev,
jenkins
Update: The pluginis now available in the official Jenkins plugin repository!
Details here: https://wiki.jenkins-ci.org/display/JENKINS/JiraTestResultReporter-plugin
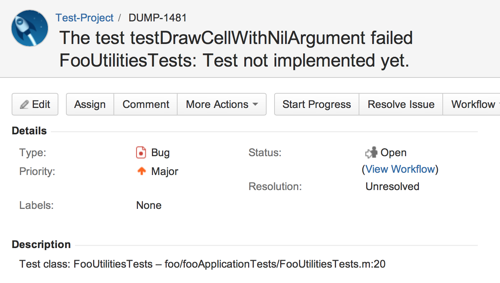
Testing your code with unit tests is a fine thing and using a Jenkins CI server for those tests is even better. Automatically creating issues in Jira for failed tests makes the workflow complete. This is what the JiraTestResultReporter plugin for Jenkins does.
This plugin examines the build job for failed unit tests. It work by using the Jenkins internal test result management for detecting failed tests. Just let Jenkins run and report your unit tests e.g. by adding the “Publish xUnit test results report” to your build job.
If JiraTestResultReporter detects new failed tests, it will create an issue for every test case in Jira:
Installation
As long as my hosting request to get the plugin included in the official plugin repository of Jenkins CI is pending, you’ll have to either build the plugin yourself or you can download the recent snapshot:
- Build yourself
- Download or clone the source code from GitHub
-
cd into the downloaded directory
- execute the maven command
mvn package
or
- Download the plugin package from here.
then
- Upload the built or downloaded file
JiraTestResultReporter.hpi to the plugins directory of your Jenkins installation or use the plugin uploader from Manage Jenkins -> Manage Plugins -> “Advanced” tab
- restart Jenkins
Usage
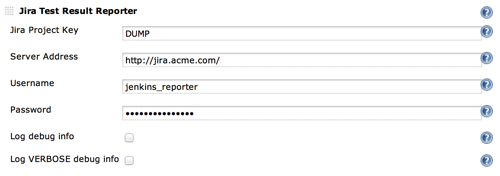
- In the build job add JiraTestResultReporter as a post-build action.
- Configure the plugin for this job. See the help boxes for details. I have the dedicated Jira user ‘jenkins_reporter’ for these kinds of automatic reports.
- Build your job. If there are failed tests, the plugin will create issues for them. This will (should!) happen only once for every new failed tests; new in this case means tests that have an age of exactly 1.