10 Mar 2013 :
jenkins,
howto,
dev,
oclint
OCLint is a static code analyzer for C, C++ and Objective-C. You’ll find it here on GitHub.
Today the maintainer merged my pull request in which I made an additional reporter module which writes a PMD-style file.
Having that, you can let the PMD Analysis run by Jenkins reports about your coding sins.
Here’s how to set the whole thing up:
1. Setup OCLint
2. Build file for Jenkins
The invocation of OCLint is configured in a build.xml. I’ll walk you through this one.
<?xml version="1.0" encoding="UTF-8"?>
<project name="fooProject" default="build-fooProject">

<property environment="env"/>

<target name="build-fooProject" depends="prepare,oclint" />

<target name="clean" description="Cleanup build artifacts">
	<delete dir="${basedir}/build/oclint" />
</target>

<target name="prepare" depends="clean" description="Prepare for build">
	<mkdir dir="${basedir}/build/oclint" />
</target>
Standard stuff so far. Setup the project and prepare the directories.
<target name="oclint">
	<antcall target="xcodebuild-clean" />
	<antcall target="xcodebuild" />
	<antcall target="oclint-xcodebuild" />
	<antcall target="oclint-parse" />
</target>
Our oclint invocation has four steps.
<target name="xcodebuild-clean">
	<exec executable="xcodebuild">
		<arg value="-configuration" />
		<arg value="Release" />
		<arg value="clean" />
	</exec>
</target>  This ensures, that we have a clean build.

<target name="xcodebuild">
	<exec executable="xcodebuild" output="xcodebuild.log">
		<arg value="-configuration" />
		<arg value="Release" />
		<arg value="-arch" />
		<arg value="armv7" />
		<arg value="CODE_SIGN_IDENTITY=" />
		<arg value="CODE_SIGNING_REQUIRED=NO" />
	</exec>
</target> Now we build our project. The important part is `output="xcodebuild.log"`; this will write the output to a file which will be fed to a helper script in the next step.

<target name="oclint-xcodebuild">
	<exec executable="PATH_TO_oclint-release/bin/oclint-xcodebuild" />
</target>
oclint-xcodebuild reads the xcodebuild.log and produces the file compile_commands.json. This file holds all the compiler stuff and is the input format for oclint.
<target name="oclint-parse">
	<exec executable="PATH_TO_oclint-release/bin/oclint-json-compilation-database">
		<env key="PATH" value="${env.PATH}:PATH_TO_oclint-release/bin/"/>
	 	<arg value="--" />
	 	<arg value="-o=${basedir}/build/oclint/lint.xml" />
	 	<arg value="-report-type=pmd" />
	 	<arg value="-stats" />
	</exec>
</target>
</project> Finally, this is where the magic happens. `oclint-json-compilation-database` feeds the `compile_commands.json` file to `oclint`. The `-report-type=pmd` flag tells it to use the PMDReporter, which will write its findings to a file called `lint.xml`.
Be sure to consult the documentation for OCLint and its helpers for the various arguments you can provide.
I created a gist with the whole file here.
- Go to the configuration page of your job in Jenkins.
- Add a build-step with the build.xml
- Add a post-build action “Publish PMD analysis results” and enter the path to the xml file we produced. In this example it would be
build/oclint/lint.xml
4. Build the job
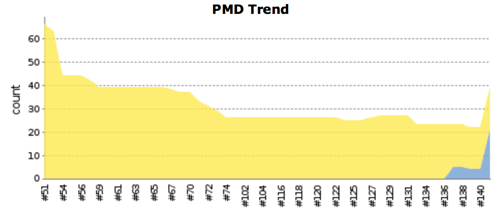
If everything worked, you should have a new section “PMD Warnings” in your build information and after a few builds the trend chart will be produced.
08 Mar 2013 :
howto,
dev
Recently I wondered why a specific method gets called way more often than I would expect. I wanted to find out, which other methods call this.
The usual approach…
… would be to set a breakpoint at the beginning of the method and look at the stack trace of Xcode’s ‘Debug Session’ pane for the calling methods. Surely a tedious way. You’ll have to write down the caller and the context that led to the caller.
A better way…
… is to utilize the breakpoint capabilities of Xcode or - more specifically - of LLDB, the new debugger which comes with the new compiler CLANG.
In this approach, you’ll also set a breakpoint at the beginning of the called method. Then select the breakpoint label and ctrl-click to get a small pop-up which let’s you define the behavior of the breakpoint:
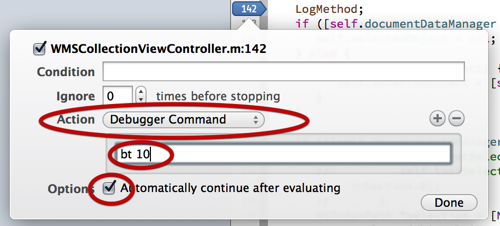
Three simple things to do:
-
Select ‘Debugger Command’ from the ‘Action’ pop-up
-
Enter ‘bt 10’ into the text field
-
Check ‘Automatically continue after evaluating’
’bt’ is a command that LLDB understands. It’s the short for ‘backtrace’. The following number defines the number of steps the trace will have. In this case ‘bt 10’ instructs the debugger to print the last 10 method calls before it hit the breakpoint. Exactly what we need.
The check we set in the third step has the simple effect, that the program keeps running, which is nice if you’re testing e.g. the GUI part of an application.
After you ran the program (don’t forget to enable breakpoints) you’ll find the logged traces in the debugger console:
* thread #1: fooApp -[WMSCollectionViewController collectionView:didSelectItemAtIndexPath:] at WMSCollectionViewController+CollectionViewDelegate.m:41, stop reason = breakpoint 2.1

frame #0: fooApp -[WMSCollectionViewController collectionView:didSelectItemAtIndexPath:] at WMSCollectionViewController+CollectionViewDelegate.m:41

#1: fooApp -[WMSCollectionViewController updateCollectionView] at WMSCollectionViewController.m:158

#2: fooApp -[WMSCollectionViewController reloadDocuments:] at WMSCollectionViewController.m:136

#3: Foundation __57-[NSNotificationCenter addObserver:selector:name:object:]_block_invoke_0

#4: CoreFoundation ___CFXNotificationPost_block_invoke_0

#5: CoreFoundation _CFXNotificationPost

#6: Foundation -[NSNotificationCenter postNotificationName:object:userInfo:]

#7: fooApp -[WMSAppDelegate checkDocumentsOpenState] at WMSAppDelegate+DocumentSetup.m:247

#8: fooApp -[WMSAppDelegate observeValueForKeyPath:ofObject:change:context:] at WMSAppDelegate+DocumentSetup.m:232

#9: Foundation NSKeyValueNotifyObserver
(I deleted some information for this purpose; so try it yourself - you’ll find a lot of useful things in there!)
So what can we learn from the output?
-
The first line marks the method that triggered the trace (the one, we set our breakpoint) and describes the thread which is useful if you have to wade through multi-threaded logic of your application.
-
As this is a trace from the viewpoint of the called method where we set the breakpoint, the frames are in reverse order. They are prefixed with frame.
-
Next is the framework or library the called method belongs to. In the example, there are method call from fooApp which is the example app itself or the frameworks (UIKit, Fondation, CoreFoundation etc.)
-
So, now we know, that initially a KVO (Key-Value-Observing) led to the call of our examined method. KVO triggered a Notification which called reloadDocuments:. In reloadDocuments: the method updateCollectionView got called and finally from that one we landed at our investigation method.
-
As a further convenience the file and line number from which a method are called is also printed.
Cool, eh?
05 Sep 2012 :
apple
AppleInsider about an interesting approach:
Apple’s new Passbook feature in iOS 6 isn’t just a coupon app; it’s a framework that enables retailers to develop smart apps for transactions, without relying on new Near Field Communications (NFC) hardware to do so.
26 Feb 2012 :
howto,
dev
HeaderDoc is a very versatile document generation system by Apple, which can handle a wide variety of languages. The latter was the reason for me to give it a chance, since other generator either work only with a specific language or produce (for me) unusable results.
HeaderDoc works fine with PHP, JavaScript etc. which makes it a perfect tool for web projects - otherwise you’ll have to deal with different tools, which can’t produce combined docs.
HeaderDocs comes with Mac OS X (at least when you have Xcode installed). But I wanted to use it on my Ubuntu server where Jenkins does all the integration stuff.
Apple has open-sourced HeaderDoc and you can find it on Apple’s open source website at http://www.opensource.apple.com/
Downlaod & unpack
Requirements
HeaderDocs is basically a PERL script, so you’ll need a recent PERL installation. This should be the case on every ‘normal’ system, so I won’t dive into installing PERL here. Besides that, HeaderDoc needs some other libraries. If they’re not installed, run the following commands:
- FreezeThaw
-
sudo apt-get install libfreezethaw-perl
- libxml2-dev
-
sudo apt-get install libxml2-dev
- xmllint (from the libxml2-utils)
-
sudo apt-get install libxml2-utils
-
checkinstall (not necessary for this installation, but you should alway use checkinstall, when manually installing software, which circumvents the Ubuntu/Debian package system!)
sudo apt-get install checkinstall
Build & install
make clean-
make - This will actually compile the software & libraries and performs a lot of tests. Three of them (‘class 3’, ‘header 5’, ‘template 1’) failed during my install, but I didn’t notice any false behaviour using HeaderDoc.
sudo checkinstall make realinstall
Ready. You should have now two files in /usr/bin/:
- headerdoc2html - the processor itself
- gatherheaderdoc - a utility to combine the docs in an overview
You’ll find the documentaion for HeaderDoc on Apple’s developer site
12 Feb 2012 :
os_x
When you see in your console log messages like
11.02.12 17:36:41,009 webdavfs_agent: network_mount: WebDAV protocol not supported; file: /SourceCache/webdavfs/webdavfs-322/ mount.tproj/webdav_network.c; line: 3131
this doesn’t necessarily mean, that Mac OS X suddenly stopped understanding the WebDAV server it could mount minutes ago. In fact it’s more likely, that the problem lies on the server side and the DAV config is incomplete.
Since the Mac OS web DAV client isn’t really chatty about what’s going (wr)on(g) here, you should use a unix WebDAV client (e.g. cadaver) for debugging.
The client can properly connect to the DAV server which you can see by the result code (“200”) in the apache log file:
"OPTIONS / HTTP/1.1" 200 250 "-" "cadaver/0.23.3 neon/0.29.0"
But the client tells you, that there’s something wrong anyhow, which you can verify again in the apache log:
"PROPFIND / HTTP/1.1" 405 508 "-" "cadaver/0.23.3 neon/0.29.0"
The result code “405” means “Method not allowed”. Does the client try to talk to the DAV server via incorrect command and Mac OS therefore reports the “not supported” message? No, it’s just that the DAV server doesn’t know how to handle the DAV protocol properly.
So go and check your server config. When I upgraded Plesk from version 10.2 to 10.4, the upgrade process didn’t catch all the relevant vhost.conf files and therefore left me with a half configured DAV server. The problem is, that Plesk 10.4 uses a different directory layout under /var/www/vhosts/ and I had to manually copy and configure the vhost.conf files to their new places.