Recently I wondered why a specific method gets called way more often than I would expect. I wanted to find out, which other methods call this.
The usual approach…
… would be to set a breakpoint at the beginning of the method and look at the stack trace of Xcode’s ‘Debug Session’ pane for the calling methods. Surely a tedious way. You’ll have to write down the caller and the context that led to the caller.
A better way…
… is to utilize the breakpoint capabilities of Xcode or - more specifically - of LLDB, the new debugger which comes with the new compiler CLANG. In this approach, you’ll also set a breakpoint at the beginning of the called method. Then select the breakpoint label and ctrl-click to get a small pop-up which let’s you define the behavior of the breakpoint:
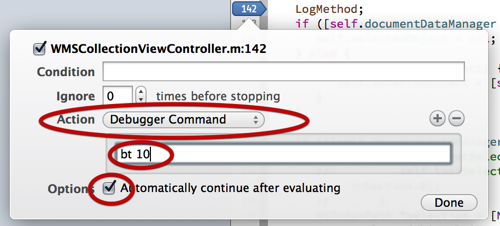
Three simple things to do:
-
Select ‘Debugger Command’ from the ‘Action’ pop-up
-
Enter ‘
bt 10’ into the text field -
Check ‘Automatically continue after evaluating’
’bt’ is a command that LLDB understands. It’s the short for ‘backtrace’. The following number defines the number of steps the trace will have. In this case ‘bt 10’ instructs the debugger to print the last 10 method calls before it hit the breakpoint. Exactly what we need.
The check we set in the third step has the simple effect, that the program keeps running, which is nice if you’re testing e.g. the GUI part of an application.
After you ran the program (don’t forget to enable breakpoints) you’ll find the logged traces in the debugger console:
* thread #1: fooApp -[WMSCollectionViewController collectionView:didSelectItemAtIndexPath:] at WMSCollectionViewController+CollectionViewDelegate.m:41, stop reason = breakpoint 2.1

frame #0: fooApp -[WMSCollectionViewController collectionView:didSelectItemAtIndexPath:] at WMSCollectionViewController+CollectionViewDelegate.m:41

#1: fooApp -[WMSCollectionViewController updateCollectionView] at WMSCollectionViewController.m:158

#2: fooApp -[WMSCollectionViewController reloadDocuments:] at WMSCollectionViewController.m:136

#3: Foundation __57-[NSNotificationCenter addObserver:selector:name:object:]_block_invoke_0

#4: CoreFoundation ___CFXNotificationPost_block_invoke_0

#5: CoreFoundation _CFXNotificationPost

#6: Foundation -[NSNotificationCenter postNotificationName:object:userInfo:]

#7: fooApp -[WMSAppDelegate checkDocumentsOpenState] at WMSAppDelegate+DocumentSetup.m:247

#8: fooApp -[WMSAppDelegate observeValueForKeyPath:ofObject:change:context:] at WMSAppDelegate+DocumentSetup.m:232

#9: Foundation NSKeyValueNotifyObserver
(I deleted some information for this purpose; so try it yourself - you’ll find a lot of useful things in there!)
So what can we learn from the output?
-
The first line marks the method that triggered the trace (the one, we set our breakpoint) and describes the thread which is useful if you have to wade through multi-threaded logic of your application.
-
As this is a trace from the viewpoint of the called method where we set the breakpoint, the frames are in reverse order. They are prefixed with
frame. -
Next is the framework or library the called method belongs to. In the example, there are method call from
fooAppwhich is the example app itself or the frameworks (UIKit,Fondation,CoreFoundationetc.) -
So, now we know, that initially a KVO (Key-Value-Observing) led to the call of our examined method. KVO triggered a Notification which called
reloadDocuments:. InreloadDocuments:the methodupdateCollectionViewgot called and finally from that one we landed at our investigation method. -
As a further convenience the file and line number from which a method are called is also printed.
Cool, eh?